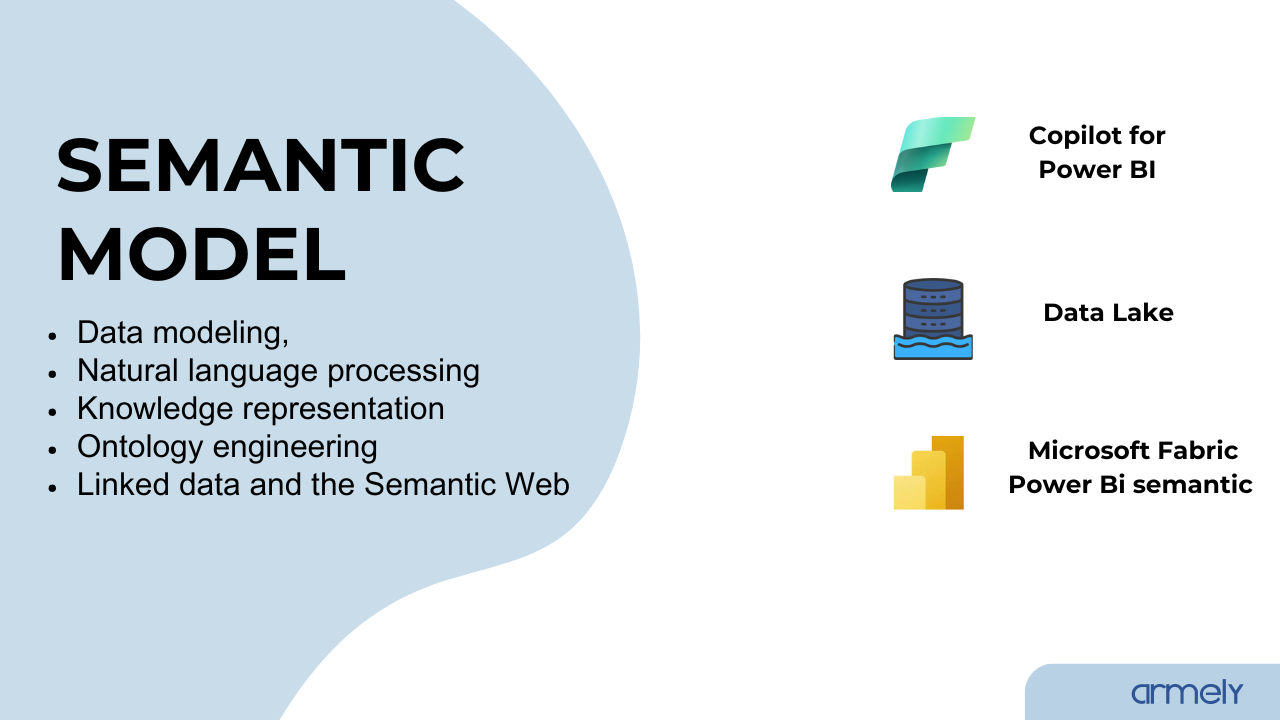

Semantic Link and Semantic Lab in Microsoft Fabric
When I first started working with semantic models in Microsoft Fabric, I loved how they powered clean dashboards in Power BI. But I always had one nagging question: What’s really happening under the hood?
Semantic models often feel like a black box, you drag in a measure, build a visual, and trust the output. But trust alone isn’t enough when the data is driving decisions. I wanted a way to peek inside, validate relationships, and even bring those curated business measures into my own data science experiments.
That’s when I discovered Semantic Link and Semantic Lab.
Why Semantic Link?
Think of Semantic Link as a bridge. On one side, you’ve got Power BI’s semantic models, polished, governed, and business ready. On the other, you’ve got notebooks, flexible, code-first, and perfect for exploration. Semantic Link is the connector that lets you bring those models into your notebook with just a few lines of Python.
Suddenly, the black box opens.
- I can list all the tables and their columns.
- I can pull measures (like Total Sales or Return Rate %) into Pandas DataFrames.
- I can evaluate those measures over time, by region, or across product categories, just like DAX, but from Python.
- I can even augment my own data with enterprise-grade metrics.
Why Semantic Lab?
If Semantic Link is the bridge, then Semantic Lab is the inspector.
It gives me tools to:
- Validate that keys actually line up (every CustomerID in FactSales exists in DimCustomers).
- Test functional dependencies (does each ProductID always map to the same ProductName?).
- Catch relationship violations (are there nulls, partial joins, or missing references?).
- Visualize the web of relationships that tie facts and dimensions together.
The Magic of Bringing It Together
Here’s what really excites me: combining both tools.
- Discover: With Semantic Link, I can explore measures, run DAX, or evaluate KPIs across time and region.
- Validate: With Semantic Lab, I check the integrity of the model itself.
- Enrich: I can bring in my own dataset, say a CSV of experimental product bundles and enrich it with Total Sales or Inventory Value from the semantic model.
This is no longer just analytics. It’s a workflow where data scientists, analysts, and engineers all speak the same language.
1. Installing and Connecting to Semantic Models
The journey starts by enabling Semantic Link in my Fabric notebook. Within seconds, I can see all the semantic models available in my workspace, including the one I’ll be using,

Now I know exactly which models I can connect to and explore.
2. Exploring Tables and Columns
Instead of guessing, Semantic Link lets me open the box and see every table and column. Dimensions like Customers, Products, and Calendar sit alongside fact tables like Sales and Returns.

Already, I have visibility into the schema and can confirm that the star schema design is intact.
3. Exploring Measures
Measures are the lifeblood of semantic models — they hold the business logic. With a quick peek, I see Total Sales, Order Count, Return Rate %, and more.

It’s not just numbers anymore, I know exactly how my KPIs are defined.
4. Evaluating Measures
With Semantic Link, I can bring those measures into action. Here, I sliced Total Sales by Year and Month.

It matches what Power BI would show me, but now I can analyze and experiment in Python.
5. Combining Multiple Metrics
Why stop at one? I pulled Total Sales, Quantity, and Return Rate % side by side.

Having KPIs together like this opens the door for deeper trend analysis and even machine learning.
6. Evaluating by Dimensions
Next, I checked sales by region.

In seconds, I had a ranked breakdown of sales by customer region, just like a report, but more flexible.
7. Augmenting My Own Data
I tested something fun: bringing in my own small dataset (two regions and two product categories). Semantic Link enriched it with enterprise KPIs.

Suddenly, my local data is powered by the same trusted metrics my business runs on.
8. Running Full DAX
Sometimes, only DAX will do. Semantic Link lets me run full DAX queries directly in my notebook.

This means I don’t lose the flexibility of DAX, even outside Power BI.
9. Validating Data Quality (Semantic Lab)
Semantic Lab steps in as the inspector. Here, I tested whether each ProductID consistently maps to one ProductName.

10. Discovering and Visualizing Relationships
Relationships define how facts and dimensions connect. Semantic Link let me list them — then plot them visually.

Now I can literally see the backbone of my model.
11. Validating Relationship Violations
And here’s where things get interesting: I ran a check and found null CustomerIDs and invalid StoreIDs.

- CustomerID had nulls — meaning some sales records weren’t tied to any customer.
- StoreID had missing matches — some store references existed in sales but not in the stores table.
- Partial joins surfaced, showing that not every value in FactSales aligned perfectly with DimStores.
This is the kind of issue that often hides behind dashboards. Reports might still run, but the totals may be misleading. By surfacing these violations early, I can:
- Fix missing dimension values before they skew insights.
- Alert data engineers to patch upstream pipelines.
- Build more trust in reports and analytics.
Why It Matters
- For Analysts: You can trust the numbers in your visuals because the relationships and dependencies are validated.
- For Data Scientists: You can leverage curated business KPIs without reinventing calculations in Python.
- For Data Engineers: You can debug and document models with visualized relationships and violation reports.
It’s not just about making data available, it’s about making it usable, reliable, and explainable.
Semantic Link and Semantic Lab have changed how I look at semantic models in Fabric. They’ve turned the black box into an open book.
And once you’ve seen inside, you won’t go back.
For more information check these link